AI & ML Models
0.0 (0 reviews) • 0 downloads
Uber Data Analysis Using ML Classifier in Python Projects
र 1000
Uber Data Analysis Using ML Classifier in Python Projects
Technical Details
Domain : Python
Database : Sqlite
Tools : Anaconda
Run Tools: VS Code
Database : Sqlite
Tools : Anaconda
Run Tools: VS Code
Secure Payment
Instant Download
GST Invoice
24/7 Support
About This Product
Uber Data Analysis Using ML Classifier in Python Projects
Abstract
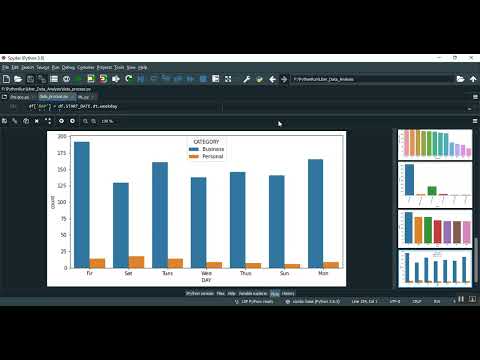
Ride-hailing platforms like Uber generate large volumes of data regarding trips, drivers, and passengers, which can be leveraged for insights and decision-making. This project focuses on Uber Data Analysis using Machine Learning Classifiers in Python, aiming to analyze patterns, predict trip outcomes, and classify rides based on different criteria such as demand, trip duration, or fare amounts. The system collects Uber trip data, preprocesses it for missing values, outliers, and normalization, and applies feature engineering to extract meaningful variables. Machine learning classifiers such as Random Forest, Decision Trees, Gradient Boosting, or Support Vector Machines are trained to categorize trips or predict specific outcomes. Python libraries including Pandas, NumPy, Matplotlib, Seaborn, and Scikit-learn are used for data preprocessing, visualization, and model development. The project aims to provide actionable insights for route optimization, demand forecasting, and operational efficiency.
Existing System
Existing Uber data analysis systems primarily rely on manual inspection, basic statistical methods, or simple dashboards to track ride trends, fare patterns, or driver performance. While such methods provide high-level summaries, they fail to capture complex relationships in the data or predict future trends. Traditional systems often do not utilize machine learning for predictive modeling or classification and lack advanced visualization for exploratory data analysis. Consequently, decision-making is limited to historical patterns, with minimal predictive capability, making it challenging to optimize routes, pricing, or resource allocation.
Proposed System
The proposed system implements a Python-based Uber data analysis framework using machine learning classifiers. Trip data is collected and preprocessed by handling missing values, encoding categorical variables, normalizing features, and performing feature engineering. Supervised machine learning classifiers such as Random Forest, Gradient Boosting, or Support Vector Machines are trained on labeled datasets to predict outcomes like trip duration, fare range, or demand classification. Data visualization using Matplotlib and Seaborn helps in identifying trends, hotspots, and anomalies. The system can provide predictions and classifications in real-time, enabling Uber or similar ride-hailing services to optimize routes, forecast demand, improve driver allocation, and enhance customer satisfaction. By combining data analysis with predictive modeling, the system delivers actionable insights and scalable solutions for ride-hailing analytics.
Abstract
Ride-hailing platforms like Uber generate large volumes of data regarding trips, drivers, and passengers, which can be leveraged for insights and decision-making. This project focuses on Uber Data Analysis using Machine Learning Classifiers in Python, aiming to analyze patterns, predict trip outcomes, and classify rides based on different criteria such as demand, trip duration, or fare amounts. The system collects Uber trip data, preprocesses it for missing values, outliers, and normalization, and applies feature engineering to extract meaningful variables. Machine learning classifiers such as Random Forest, Decision Trees, Gradient Boosting, or Support Vector Machines are trained to categorize trips or predict specific outcomes. Python libraries including Pandas, NumPy, Matplotlib, Seaborn, and Scikit-learn are used for data preprocessing, visualization, and model development. The project aims to provide actionable insights for route optimization, demand forecasting, and operational efficiency.
Existing System
Existing Uber data analysis systems primarily rely on manual inspection, basic statistical methods, or simple dashboards to track ride trends, fare patterns, or driver performance. While such methods provide high-level summaries, they fail to capture complex relationships in the data or predict future trends. Traditional systems often do not utilize machine learning for predictive modeling or classification and lack advanced visualization for exploratory data analysis. Consequently, decision-making is limited to historical patterns, with minimal predictive capability, making it challenging to optimize routes, pricing, or resource allocation.
Proposed System
The proposed system implements a Python-based Uber data analysis framework using machine learning classifiers. Trip data is collected and preprocessed by handling missing values, encoding categorical variables, normalizing features, and performing feature engineering. Supervised machine learning classifiers such as Random Forest, Gradient Boosting, or Support Vector Machines are trained on labeled datasets to predict outcomes like trip duration, fare range, or demand classification. Data visualization using Matplotlib and Seaborn helps in identifying trends, hotspots, and anomalies. The system can provide predictions and classifications in real-time, enabling Uber or similar ride-hailing services to optimize routes, forecast demand, improve driver allocation, and enhance customer satisfaction. By combining data analysis with predictive modeling, the system delivers actionable insights and scalable solutions for ride-hailing analytics.
Customer Reviews (0)
No reviews yet. Be the first!
Related Products
⭐ Featured
AI & ML Models
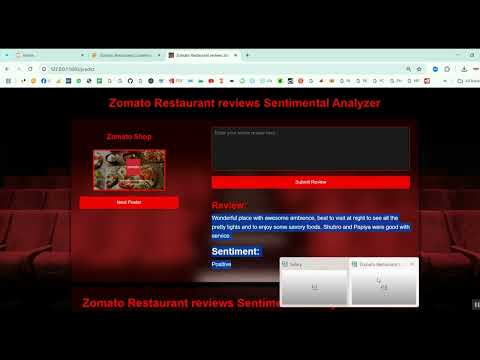
Zomato Restaurant Reviews Sentimental Analyzer in Python Projects
Zomato Restaurant Reviews Sentimental Analyzer in Python Projects
र 1000
⭐ Featured
⭐ Featured
AI & ML Models
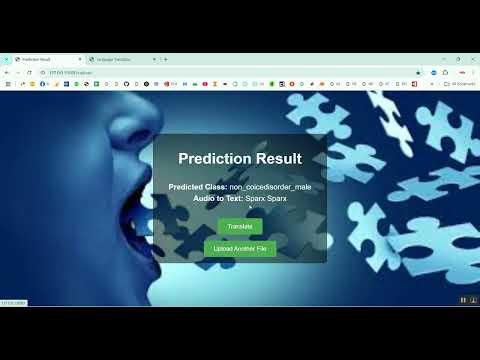
Voice Disorder Prediction using Audio Dataset in Python Projects
Voice Disorder Prediction using Audio Dataset in Python Projects
र 1000

AI & ML Models
Vitamin Deficiency Detection Using Image Processing in Python Projects
Vitamin Deficiency Detection Using Image Processing in Python Projects
र 1000