AI & ML Models
0.0 (0 reviews) • 0 downloads
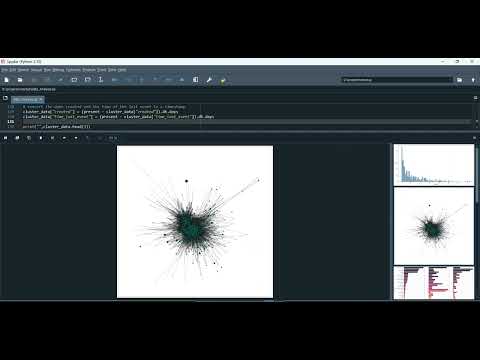
Meetup Data Analysis Training in Python Projects
र 1000
Meetup Data Analysis Training in Python Projects
Technical Details
Domain : Python
Database : Sqlite
Tools : Anaconda
Run Tools: VS Code
Database : Sqlite
Tools : Anaconda
Run Tools: VS Code
Secure Payment
Instant Download
GST Invoice
24/7 Support
About This Product
Meetup Data Analysis Training in Python Projects
Abstract
The Meetup Data Analysis Training Project is a data-driven application developed in Python that focuses on analyzing and understanding user engagement, event popularity, and community activity patterns from Meetup datasets. The project aims to extract meaningful insights from event-related data such as user participation, location trends, event frequency, and feedback sentiment. By using data analysis and visualization techniques, the system helps identify trends in community behavior, preferred topics, and event success rates. Python libraries such as Pandas, NumPy, Matplotlib, and Seaborn are utilized for data preprocessing, statistical analysis, and visualization. The model can also integrate machine learning algorithms to predict future event attendance or identify factors influencing event engagement. This project serves as a training and research platform for data analytics, empowering users to make data-driven decisions for organizing and improving Meetup events.
Existing System
In existing Meetup platforms, while large amounts of data are generated daily, they are often underutilized due to a lack of efficient analytical tools. Traditional systems rely on manual inspection of attendance records and feedback, which makes it difficult to identify event trends, active communities, or the factors behind user engagement. Furthermore, existing solutions often lack integration with data visualization tools or predictive analytics that can forecast participation rates. Without automation, data analysis becomes time-consuming and prone to inaccuracies, preventing organizers from making informed, strategic decisions.
Proposed System
The proposed Meetup Data Analysis Training System introduces an automated and efficient way to analyze and visualize Meetup event data. The system collects event details, user participation metrics, and location information, then performs data cleaning and feature extraction to ensure accurate insights. It applies descriptive analytics to summarize user behavior and predictive analytics to forecast attendance or event success using machine learning models such as regression and classification algorithms. Visualization dashboards display trends in attendance, category-wise event distribution, and time-based participation patterns. Built entirely in Python, this system provides a training-friendly framework for data analysts and students to practice data preprocessing, model building, and interpretation. The project also helps Meetup organizers optimize event planning and enhance user engagement by making decisions backed by data-driven insights.
Abstract
The Meetup Data Analysis Training Project is a data-driven application developed in Python that focuses on analyzing and understanding user engagement, event popularity, and community activity patterns from Meetup datasets. The project aims to extract meaningful insights from event-related data such as user participation, location trends, event frequency, and feedback sentiment. By using data analysis and visualization techniques, the system helps identify trends in community behavior, preferred topics, and event success rates. Python libraries such as Pandas, NumPy, Matplotlib, and Seaborn are utilized for data preprocessing, statistical analysis, and visualization. The model can also integrate machine learning algorithms to predict future event attendance or identify factors influencing event engagement. This project serves as a training and research platform for data analytics, empowering users to make data-driven decisions for organizing and improving Meetup events.
Existing System
In existing Meetup platforms, while large amounts of data are generated daily, they are often underutilized due to a lack of efficient analytical tools. Traditional systems rely on manual inspection of attendance records and feedback, which makes it difficult to identify event trends, active communities, or the factors behind user engagement. Furthermore, existing solutions often lack integration with data visualization tools or predictive analytics that can forecast participation rates. Without automation, data analysis becomes time-consuming and prone to inaccuracies, preventing organizers from making informed, strategic decisions.
Proposed System
The proposed Meetup Data Analysis Training System introduces an automated and efficient way to analyze and visualize Meetup event data. The system collects event details, user participation metrics, and location information, then performs data cleaning and feature extraction to ensure accurate insights. It applies descriptive analytics to summarize user behavior and predictive analytics to forecast attendance or event success using machine learning models such as regression and classification algorithms. Visualization dashboards display trends in attendance, category-wise event distribution, and time-based participation patterns. Built entirely in Python, this system provides a training-friendly framework for data analysts and students to practice data preprocessing, model building, and interpretation. The project also helps Meetup organizers optimize event planning and enhance user engagement by making decisions backed by data-driven insights.
Customer Reviews (0)
No reviews yet. Be the first!
Related Products
⭐ Featured
AI & ML Models
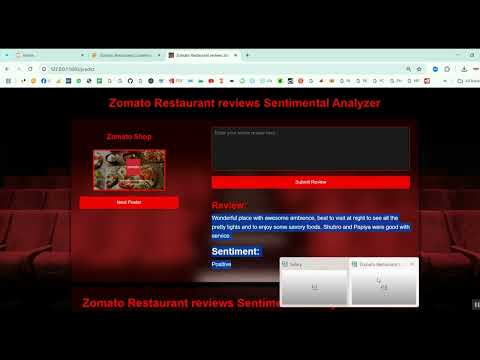
Zomato Restaurant Reviews Sentimental Analyzer in Python Projects
Zomato Restaurant Reviews Sentimental Analyzer in Python Projects
र 1000
⭐ Featured
⭐ Featured
AI & ML Models
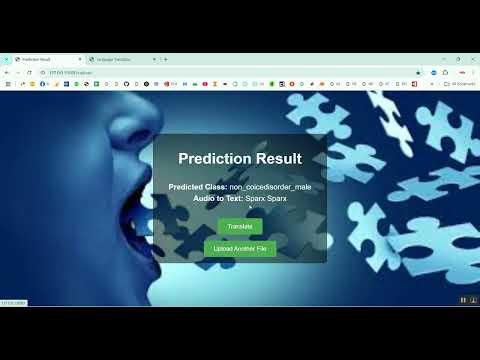
Voice Disorder Prediction using Audio Dataset in Python Projects
Voice Disorder Prediction using Audio Dataset in Python Projects
र 1000
AI & ML Models
Vitamin Deficiency Detection Using Image Processing in Python Projects
Vitamin Deficiency Detection Using Image Processing in Python Projects
र 1000