AI & ML Models
0.0 (0 reviews) • 0 downloads
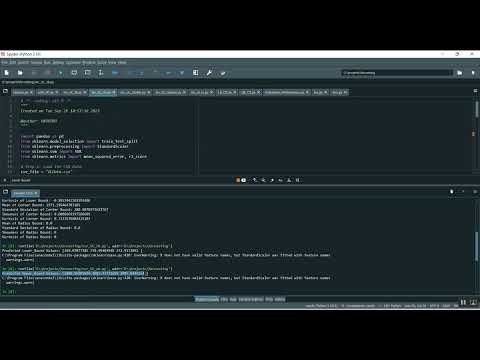
Electricity Forecasting SVR ELM in Python Projects
र 1000
Electricity Forecasting SVR ELM in Python Projects
Technical Details
Domain : Python
Database : Sqlite
Tools : Anaconda
Run Tools: VS Code
Database : Sqlite
Tools : Anaconda
Run Tools: VS Code
Secure Payment
Instant Download
GST Invoice
24/7 Support
About This Product
Electricity Forecasting SVR ELM in Python Projects
Abstract
The project “Electricity Forecasting using SVR and ELM in Python” focuses on predicting electricity demand and consumption patterns using machine learning techniques. Accurate electricity forecasting is crucial for power grid management, load balancing, and energy optimization. This system uses historical electricity consumption data, weather parameters, and time-related features to train models. Support Vector Regression (SVR) and Extreme Learning Machine (ELM) algorithms are applied to predict short-term and medium-term electricity demand. Python libraries such as Pandas, NumPy, Scikit-learn, and Matplotlib are used for data preprocessing, model training, evaluation, and visualization. The project demonstrates how hybrid machine learning approaches can enhance the accuracy and reliability of electricity forecasting.
Existing System
Traditional electricity forecasting methods rely on statistical techniques like ARIMA, moving averages, and regression models. While effective for simple trends, these methods struggle to capture non-linear patterns, sudden load fluctuations, and weather-dependent variations. Existing models often require extensive manual tuning and fail to provide high accuracy in real-time or near real-time prediction scenarios. Additionally, many current solutions do not integrate advanced machine learning models that can handle large datasets and complex temporal relationships in electricity consumption.
Proposed System
The proposed system introduces a Python-based electricity forecasting framework using SVR and ELM. Historical electricity usage and external factors like temperature, humidity, and time-of-day are preprocessed, normalized, and used as input features. The SVR model captures non-linear dependencies between features, while the ELM model provides fast learning and generalization for large datasets. The system evaluates model performance using metrics like Mean Absolute Error (MAE), Root Mean Squared Error (RMSE), and R² score. The results can be visualized using Matplotlib or Plotly dashboards, showing predicted vs actual electricity consumption. This hybrid approach ensures improved accuracy, computational efficiency, and scalability for energy providers and smart grid management.
Abstract
The project “Electricity Forecasting using SVR and ELM in Python” focuses on predicting electricity demand and consumption patterns using machine learning techniques. Accurate electricity forecasting is crucial for power grid management, load balancing, and energy optimization. This system uses historical electricity consumption data, weather parameters, and time-related features to train models. Support Vector Regression (SVR) and Extreme Learning Machine (ELM) algorithms are applied to predict short-term and medium-term electricity demand. Python libraries such as Pandas, NumPy, Scikit-learn, and Matplotlib are used for data preprocessing, model training, evaluation, and visualization. The project demonstrates how hybrid machine learning approaches can enhance the accuracy and reliability of electricity forecasting.
Existing System
Traditional electricity forecasting methods rely on statistical techniques like ARIMA, moving averages, and regression models. While effective for simple trends, these methods struggle to capture non-linear patterns, sudden load fluctuations, and weather-dependent variations. Existing models often require extensive manual tuning and fail to provide high accuracy in real-time or near real-time prediction scenarios. Additionally, many current solutions do not integrate advanced machine learning models that can handle large datasets and complex temporal relationships in electricity consumption.
Proposed System
The proposed system introduces a Python-based electricity forecasting framework using SVR and ELM. Historical electricity usage and external factors like temperature, humidity, and time-of-day are preprocessed, normalized, and used as input features. The SVR model captures non-linear dependencies between features, while the ELM model provides fast learning and generalization for large datasets. The system evaluates model performance using metrics like Mean Absolute Error (MAE), Root Mean Squared Error (RMSE), and R² score. The results can be visualized using Matplotlib or Plotly dashboards, showing predicted vs actual electricity consumption. This hybrid approach ensures improved accuracy, computational efficiency, and scalability for energy providers and smart grid management.
Customer Reviews (0)
No reviews yet. Be the first!
Related Products
⭐ Featured
AI & ML Models
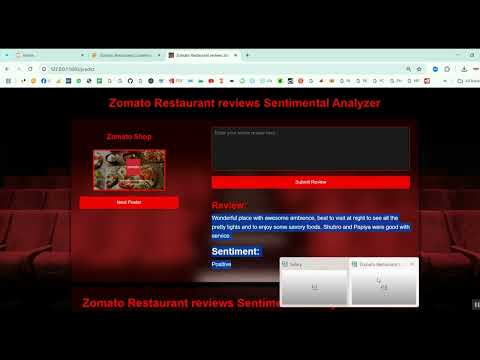
Zomato Restaurant Reviews Sentimental Analyzer in Python Projects
Zomato Restaurant Reviews Sentimental Analyzer in Python Projects
र 1000
⭐ Featured
⭐ Featured
AI & ML Models
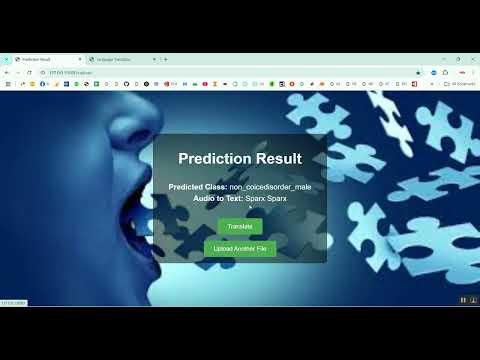
Voice Disorder Prediction using Audio Dataset in Python Projects
Voice Disorder Prediction using Audio Dataset in Python Projects
र 1000

AI & ML Models
Vitamin Deficiency Detection Using Image Processing in Python Projects
Vitamin Deficiency Detection Using Image Processing in Python Projects
र 1000