AI & ML Models
0.0 (0 reviews) • 0 downloads
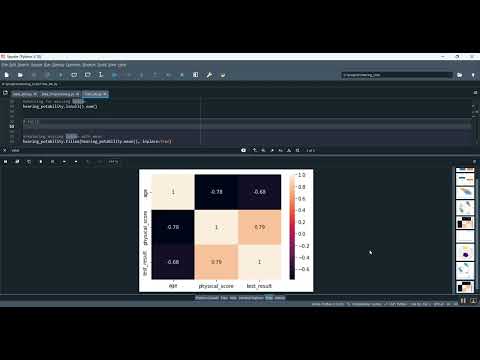
Earning Loss Prediction Jupyter Streamlit in Python Projects
र 1000
Earning Loss Prediction Jupyter Streamlit in Python Projects
Technical Details
Domain : Python
Database : Sqlite
Tools : Anaconda
Run Tools: VS Code
Database : Sqlite
Tools : Anaconda
Run Tools: VS Code
Secure Payment
Instant Download
GST Invoice
24/7 Support
About This Product
Earning Loss Prediction Jupyter Streamlit in Python Projects
Abstract
Financial forecasting is a critical task for businesses and individuals to assess potential earnings and losses in dynamic economic environments. This project focuses on developing a Python-based Earning Loss Prediction system that integrates Jupyter Notebook for data analysis and Streamlit for interactive visualization. Using historical financial data, the system employs machine learning algorithms to predict future earning trends and identify possible loss risks. Implemented with Python libraries such as Pandas, NumPy, Scikit-learn, and TensorFlow/Keras, the system provides data-driven insights through a simple, user-friendly web interface. This enables decision-makers to visualize trends, understand influencing factors, and take proactive actions to mitigate financial loss.
Existing System
Traditional financial forecasting methods rely on manual data analysis, linear regression models, or spreadsheet-based calculations. These approaches are limited by human error, lack of automation, and difficulty handling large datasets with multiple influencing variables such as market trends, inflation, or sales fluctuations. Existing systems often fail to integrate real-time visualization tools, making it challenging for users to interactively explore predictions and adjust parameters dynamically. Additionally, most traditional methods lack adaptability to new data and cannot accurately model complex non-linear relationships.
Proposed System
The proposed system introduces an intelligent, Python-based framework for predicting earnings and losses using machine learning algorithms and an interactive Streamlit dashboard. Data is collected from financial records or simulated datasets and preprocessed using cleaning, normalization, and feature engineering techniques. Machine learning algorithms such as Linear Regression, Random Forest, or LSTM models are applied to predict future earnings and potential loss patterns. The results are visualized through Streamlit, allowing users to view graphical trends, adjust input parameters, and compare predicted versus actual outcomes. The system is first developed and tested in Jupyter Notebook for experimentation, then deployed through a Streamlit interface for end-user accessibility. Python libraries such as Pandas and NumPy support data preprocessing, Scikit-learn and TensorFlow/Keras handle model training, and Matplotlib or Plotly are used for visualization. By integrating predictive modeling with an interactive web interface, the system provides a scalable, transparent, and efficient solution for financial risk assessment and earnings management.
Abstract
Financial forecasting is a critical task for businesses and individuals to assess potential earnings and losses in dynamic economic environments. This project focuses on developing a Python-based Earning Loss Prediction system that integrates Jupyter Notebook for data analysis and Streamlit for interactive visualization. Using historical financial data, the system employs machine learning algorithms to predict future earning trends and identify possible loss risks. Implemented with Python libraries such as Pandas, NumPy, Scikit-learn, and TensorFlow/Keras, the system provides data-driven insights through a simple, user-friendly web interface. This enables decision-makers to visualize trends, understand influencing factors, and take proactive actions to mitigate financial loss.
Existing System
Traditional financial forecasting methods rely on manual data analysis, linear regression models, or spreadsheet-based calculations. These approaches are limited by human error, lack of automation, and difficulty handling large datasets with multiple influencing variables such as market trends, inflation, or sales fluctuations. Existing systems often fail to integrate real-time visualization tools, making it challenging for users to interactively explore predictions and adjust parameters dynamically. Additionally, most traditional methods lack adaptability to new data and cannot accurately model complex non-linear relationships.
Proposed System
The proposed system introduces an intelligent, Python-based framework for predicting earnings and losses using machine learning algorithms and an interactive Streamlit dashboard. Data is collected from financial records or simulated datasets and preprocessed using cleaning, normalization, and feature engineering techniques. Machine learning algorithms such as Linear Regression, Random Forest, or LSTM models are applied to predict future earnings and potential loss patterns. The results are visualized through Streamlit, allowing users to view graphical trends, adjust input parameters, and compare predicted versus actual outcomes. The system is first developed and tested in Jupyter Notebook for experimentation, then deployed through a Streamlit interface for end-user accessibility. Python libraries such as Pandas and NumPy support data preprocessing, Scikit-learn and TensorFlow/Keras handle model training, and Matplotlib or Plotly are used for visualization. By integrating predictive modeling with an interactive web interface, the system provides a scalable, transparent, and efficient solution for financial risk assessment and earnings management.
Customer Reviews (0)
No reviews yet. Be the first!
Related Products
⭐ Featured
AI & ML Models
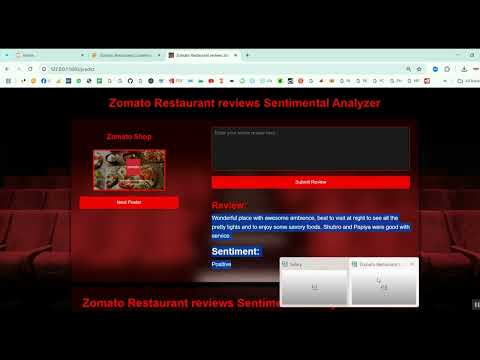
Zomato Restaurant Reviews Sentimental Analyzer in Python Projects
Zomato Restaurant Reviews Sentimental Analyzer in Python Projects
र 1000
⭐ Featured
⭐ Featured
AI & ML Models
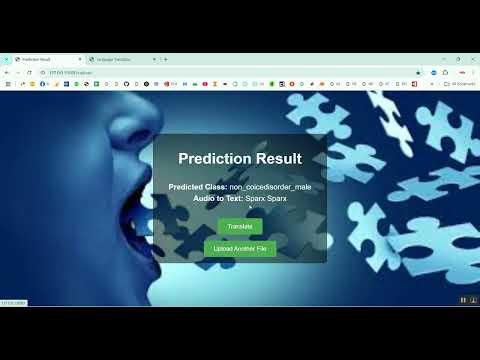
Voice Disorder Prediction using Audio Dataset in Python Projects
Voice Disorder Prediction using Audio Dataset in Python Projects
र 1000
AI & ML Models
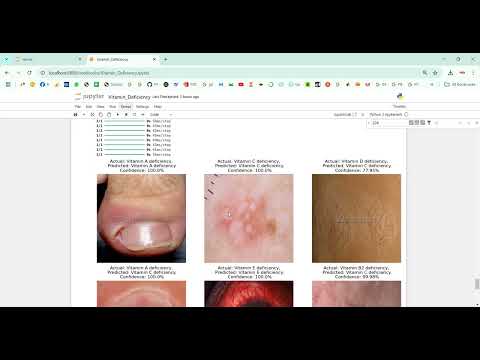
Vitamin Deficiency Detection Using Image Processing in Python Projects
Vitamin Deficiency Detection Using Image Processing in Python Projects
र 1000