AI & ML Models
0.0 (0 reviews) • 0 downloads
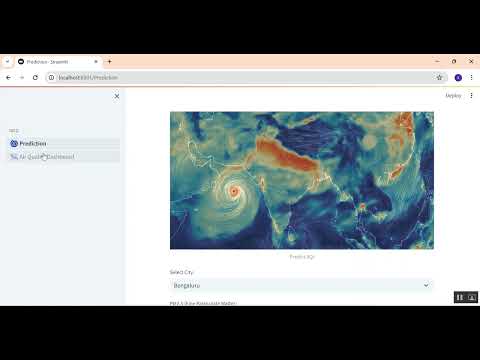
Air Quality Visualizing Pollution Level based on citys in Python Projects
र 1000
Air Quality Visualizing Pollution Level based on citys in Python Projects
Technical Details
Domain : Python
Database : Sqlite
Tools : Anaconda
Run Tools: VS Code
Database : Sqlite
Tools : Anaconda
Run Tools: VS Code
Secure Payment
Instant Download
GST Invoice
24/7 Support
About This Product
Air Quality Visualizing Pollution Level based on citys in Python Projects
Abstract
Air pollution has become a global concern due to rapid industrialization, urbanization, and increasing vehicular emissions. Monitoring air quality is essential to assess environmental health and protect public life from pollution-related diseases. This project introduces a Python-based Air Quality Visualization System that analyzes and visualizes pollution levels across different cities. The system uses real-time or historical air quality datasets containing pollutant values such as PM2.5, PM10, NO₂, SO₂, CO, and O₃. Using Python libraries like Pandas, NumPy, Matplotlib, Plotly, and Seaborn, the data is processed and visually represented through interactive charts, heat maps, and pollution trend graphs. The system provides an easy-to-understand graphical representation of the Air Quality Index (AQI) based on city-wise comparison. It helps users, researchers, and environmental authorities visualize pollution patterns, identify highly polluted areas, and take preventive measures effectively.
Existing System
The existing air quality monitoring system typically relies on government websites and environmental agency portals that display pollution data in a static tabular format. These platforms lack interactive visualization, making it difficult for users to understand city-wise pollution variations clearly. Most environmental dashboards do not allow custom analysis, filtering, or visualization of AQI based on user requirements. Additionally, existing systems do not support advanced data analysis like trend detection, seasonal variation analysis, or pollutant contribution analysis. Users are restricted to pre-designed reports that provide limited insights. The lack of customized visualization and analytical tools limits the ability of students, researchers, and policymakers to study pollution behavior in depth, reducing the usefulness of current monitoring platforms.
Proposed System
The proposed system introduces a Python-based pollution visualization application that provides dynamic and interactive charts to compare air quality across cities. The model processes air quality datasets, calculates AQI values, and visualizes pollution trends over time. Users can explore pollutant levels city-wise using bar graphs, line plots, scatter plots, heatmaps, and geo-visual maps. The system also highlights the most polluted and least polluted cities, enabling better decision-making for pollution control and health safety. It offers options to filter data by date, city, or pollutant type. The application can also integrate with online APIs such as OpenAQ or AQICN to fetch real-time AQI values. The visual dashboard provides a simple yet powerful interface for environmental analysis, making it suitable for academic research, public awareness, and policy planning. This proposed approach improves air pollution understanding through meaningful visual insights.
Abstract
Air pollution has become a global concern due to rapid industrialization, urbanization, and increasing vehicular emissions. Monitoring air quality is essential to assess environmental health and protect public life from pollution-related diseases. This project introduces a Python-based Air Quality Visualization System that analyzes and visualizes pollution levels across different cities. The system uses real-time or historical air quality datasets containing pollutant values such as PM2.5, PM10, NO₂, SO₂, CO, and O₃. Using Python libraries like Pandas, NumPy, Matplotlib, Plotly, and Seaborn, the data is processed and visually represented through interactive charts, heat maps, and pollution trend graphs. The system provides an easy-to-understand graphical representation of the Air Quality Index (AQI) based on city-wise comparison. It helps users, researchers, and environmental authorities visualize pollution patterns, identify highly polluted areas, and take preventive measures effectively.
Existing System
The existing air quality monitoring system typically relies on government websites and environmental agency portals that display pollution data in a static tabular format. These platforms lack interactive visualization, making it difficult for users to understand city-wise pollution variations clearly. Most environmental dashboards do not allow custom analysis, filtering, or visualization of AQI based on user requirements. Additionally, existing systems do not support advanced data analysis like trend detection, seasonal variation analysis, or pollutant contribution analysis. Users are restricted to pre-designed reports that provide limited insights. The lack of customized visualization and analytical tools limits the ability of students, researchers, and policymakers to study pollution behavior in depth, reducing the usefulness of current monitoring platforms.
Proposed System
The proposed system introduces a Python-based pollution visualization application that provides dynamic and interactive charts to compare air quality across cities. The model processes air quality datasets, calculates AQI values, and visualizes pollution trends over time. Users can explore pollutant levels city-wise using bar graphs, line plots, scatter plots, heatmaps, and geo-visual maps. The system also highlights the most polluted and least polluted cities, enabling better decision-making for pollution control and health safety. It offers options to filter data by date, city, or pollutant type. The application can also integrate with online APIs such as OpenAQ or AQICN to fetch real-time AQI values. The visual dashboard provides a simple yet powerful interface for environmental analysis, making it suitable for academic research, public awareness, and policy planning. This proposed approach improves air pollution understanding through meaningful visual insights.
Customer Reviews (0)
No reviews yet. Be the first!
Related Products
⭐ Featured
AI & ML Models
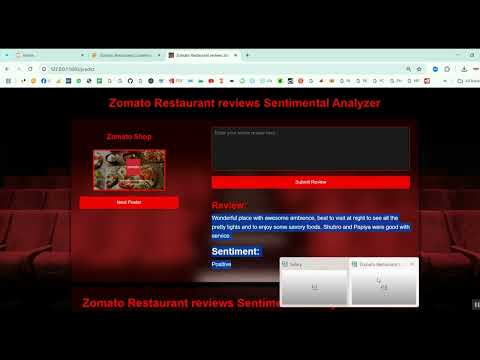
Zomato Restaurant Reviews Sentimental Analyzer in Python Projects
Zomato Restaurant Reviews Sentimental Analyzer in Python Projects
र 1000
⭐ Featured
⭐ Featured
AI & ML Models
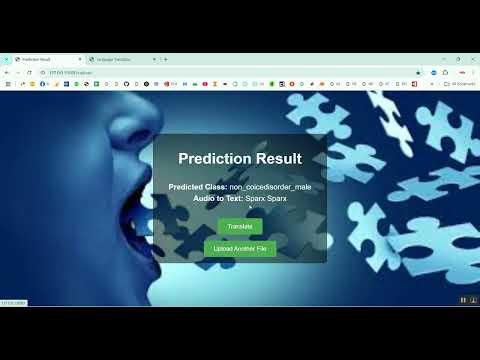
Voice Disorder Prediction using Audio Dataset in Python Projects
Voice Disorder Prediction using Audio Dataset in Python Projects
र 1000
AI & ML Models
Vitamin Deficiency Detection Using Image Processing in Python Projects
Vitamin Deficiency Detection Using Image Processing in Python Projects
र 1000