AI & ML Models
0.0 (0 reviews) • 0 downloads
Air Quality Streamlit Application in Python Projects
Air Quality Streamlit Application in Python Projects
Technical Details
Domain : Python
Database : Sqlite
Tools : Anaconda
Run Tools: VS Code
Database : Sqlite
Tools : Anaconda
Run Tools: VS Code
Secure Payment
Instant Download
GST Invoice
24/7 Support
About This Product
Air Quality Streamlit Application in Python Projects
Abstract
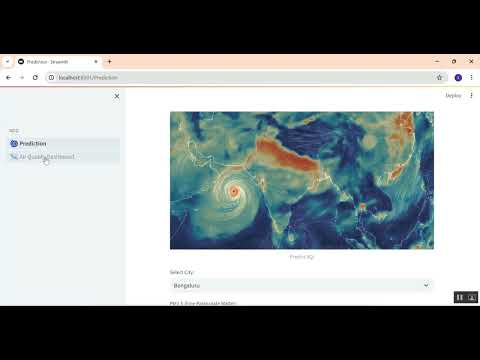
Air pollution is a major environmental issue that affects public health, climate conditions, and ecosystem balance. The Air Quality Streamlit Application in Python aims to provide a real-time and interactive platform for monitoring and analyzing air quality parameters. The application utilizes datasets containing pollutant concentrations such as PM2.5, PM10, NO₂, CO, SO₂, and O₃ to calculate and visualize the Air Quality Index (AQI). Python libraries like Pandas, NumPy, Scikit-learn, and Plotly are used for data processing, machine learning-based AQI prediction, and visualization, while Streamlit is employed to build a user-friendly web interface. Users can upload datasets or fetch real-time data from online sources to monitor pollution levels. The system predicts future AQI values and provides health recommendations based on air quality categories. This application promotes environmental awareness and supports decision-making in smart city development and environmental management.
Existing System
The existing air quality monitoring systems are mostly managed by government agencies and environmental boards. These systems use static dashboards that display AQI values for specific locations but lack personalized analysis and interactive capabilities. Most platforms do not allow users to upload custom datasets or view AI-based predictions for pollution trends. Additionally, traditional systems focus only on displaying raw data without meaningful insights, visual analytics, or preventive health guidelines. Access to historical trends and predictive analytics is limited, making it difficult to assess long-term pollution behavior. Users must rely on multiple websites or technical tools to analyze air quality data, which is inconvenient and time-consuming. Thus, current systems lack real-time interaction, predictive intelligence, and ease of use for students, researchers, and the general public.
Proposed System
The proposed system introduces a Streamlit-based Air Quality Monitoring and Prediction Application that offers a dynamic, interactive, and intelligent air quality analysis platform. The application preprocesses air quality datasets, calculates pollutant concentrations, and predicts AQI using machine learning algorithms such as Random Forest Regression, Linear Regression, or XGBoost. The Streamlit interface allows users to view pollutant trends through interactive graphs, generate AQI reports, and analyze pollution levels by city or date range. The model also categorizes AQI into standard levels—Good, Moderate, Unhealthy, and Hazardous—according to environmental guidelines and provides precautionary health suggestions. Users can upload CSV datasets or view real-time data visualizations using built-in dashboard components. The system enables easy web deployment, making it accessible for academic use, research, and public awareness. It is fast, flexible, and provides meaningful insights through AI-powered analysis and interactive visual tools.
Abstract
Air pollution is a major environmental issue that affects public health, climate conditions, and ecosystem balance. The Air Quality Streamlit Application in Python aims to provide a real-time and interactive platform for monitoring and analyzing air quality parameters. The application utilizes datasets containing pollutant concentrations such as PM2.5, PM10, NO₂, CO, SO₂, and O₃ to calculate and visualize the Air Quality Index (AQI). Python libraries like Pandas, NumPy, Scikit-learn, and Plotly are used for data processing, machine learning-based AQI prediction, and visualization, while Streamlit is employed to build a user-friendly web interface. Users can upload datasets or fetch real-time data from online sources to monitor pollution levels. The system predicts future AQI values and provides health recommendations based on air quality categories. This application promotes environmental awareness and supports decision-making in smart city development and environmental management.
Existing System
The existing air quality monitoring systems are mostly managed by government agencies and environmental boards. These systems use static dashboards that display AQI values for specific locations but lack personalized analysis and interactive capabilities. Most platforms do not allow users to upload custom datasets or view AI-based predictions for pollution trends. Additionally, traditional systems focus only on displaying raw data without meaningful insights, visual analytics, or preventive health guidelines. Access to historical trends and predictive analytics is limited, making it difficult to assess long-term pollution behavior. Users must rely on multiple websites or technical tools to analyze air quality data, which is inconvenient and time-consuming. Thus, current systems lack real-time interaction, predictive intelligence, and ease of use for students, researchers, and the general public.
Proposed System
The proposed system introduces a Streamlit-based Air Quality Monitoring and Prediction Application that offers a dynamic, interactive, and intelligent air quality analysis platform. The application preprocesses air quality datasets, calculates pollutant concentrations, and predicts AQI using machine learning algorithms such as Random Forest Regression, Linear Regression, or XGBoost. The Streamlit interface allows users to view pollutant trends through interactive graphs, generate AQI reports, and analyze pollution levels by city or date range. The model also categorizes AQI into standard levels—Good, Moderate, Unhealthy, and Hazardous—according to environmental guidelines and provides precautionary health suggestions. Users can upload CSV datasets or view real-time data visualizations using built-in dashboard components. The system enables easy web deployment, making it accessible for academic use, research, and public awareness. It is fast, flexible, and provides meaningful insights through AI-powered analysis and interactive visual tools.
Customer Reviews (0)
No reviews yet. Be the first!
Related Products
⭐ Featured
AI & ML Models
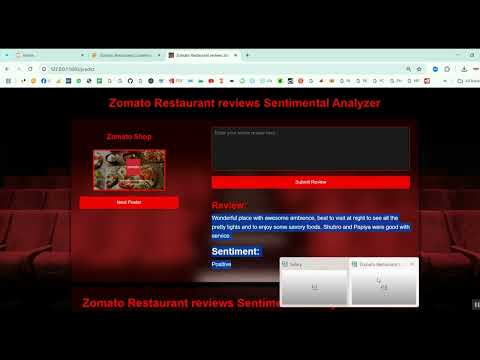
Zomato Restaurant Reviews Sentimental Analyzer in Python Projects
Zomato Restaurant Reviews Sentimental Analyzer in Python Projects
र 1000
⭐ Featured
⭐ Featured
AI & ML Models
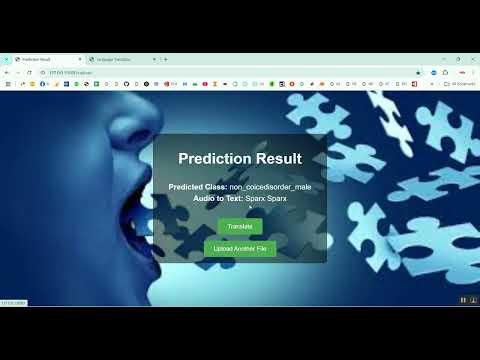
Voice Disorder Prediction using Audio Dataset in Python Projects
Voice Disorder Prediction using Audio Dataset in Python Projects
र 1000
AI & ML Models
Vitamin Deficiency Detection Using Image Processing in Python Projects
Vitamin Deficiency Detection Using Image Processing in Python Projects
र 1000